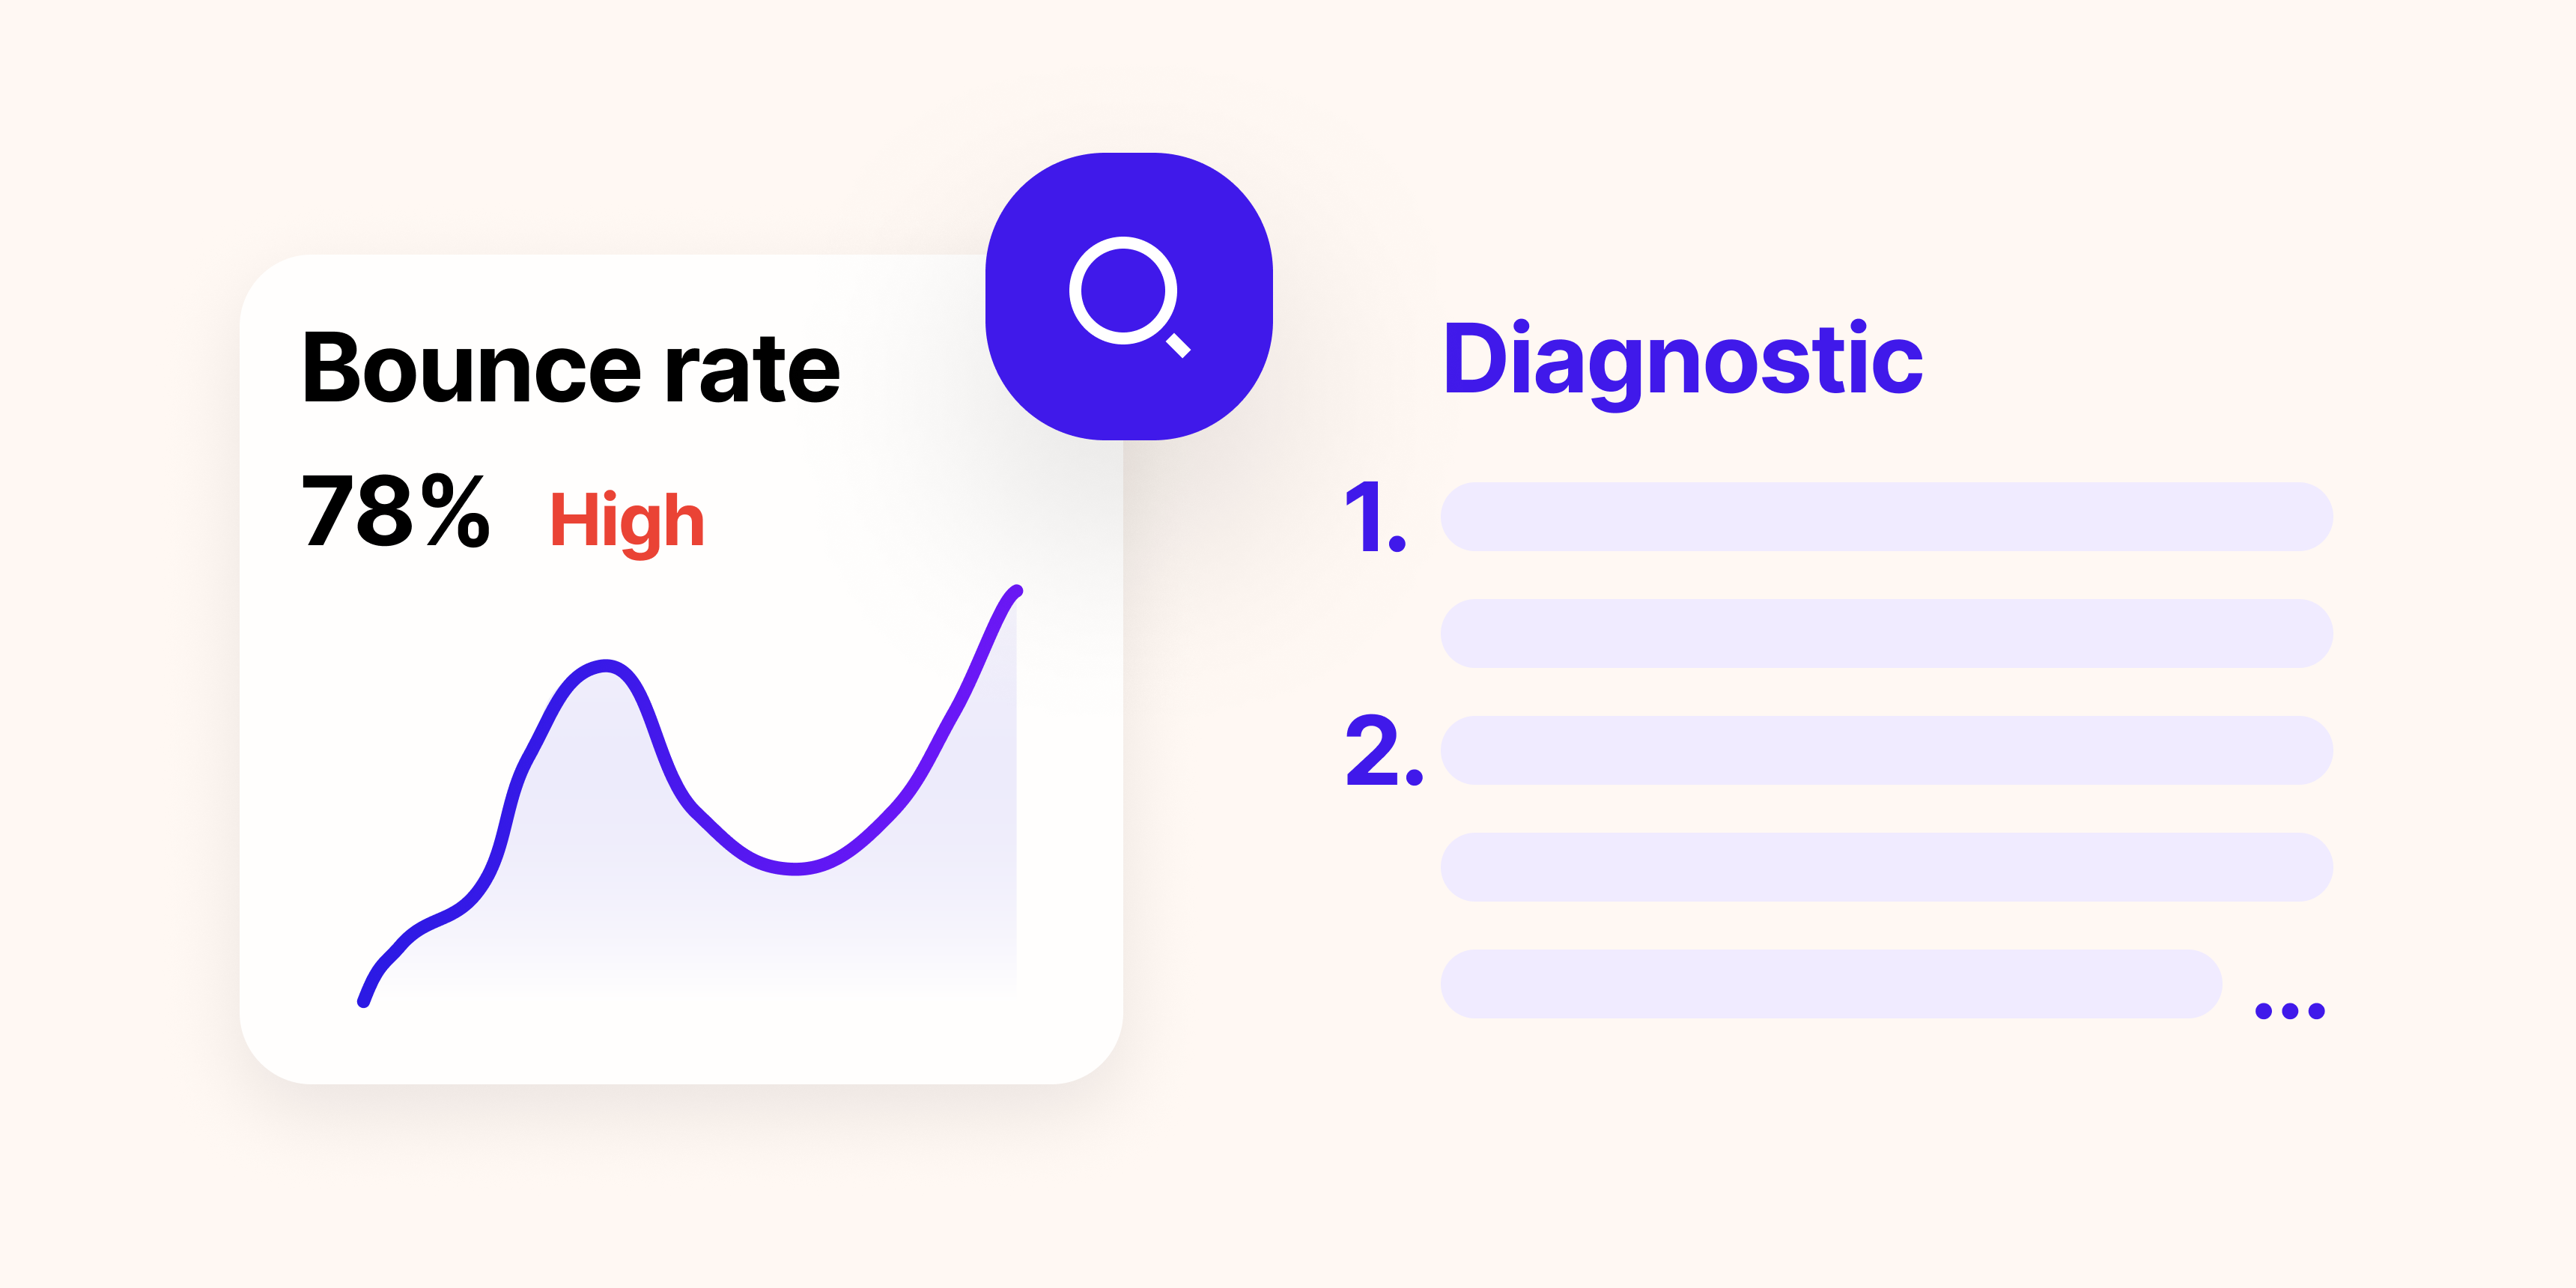
Your traffic chart just dropped, and your first instinct is to assume the worst: a Google penalty, a competitor that overtook you, an algorithm update that buried you. Take a breath. Most traffic drops are either not real or have a mundane, fixable cause. The teams that recover fast don't panic and rebuild their SEO strategy overnight. They run a checklist.
Panic leads to the wrong fix. If you start rewriting content to escape a "penalty" that never happened, you waste weeks and the real cause (e.g. a tracking tag removed during last week's deploy) keeps bleeding. This guide is that checklist: a calm, ordered diagnostic that goes from "is the drop even real?" to the root cause, fastest and most likely first.
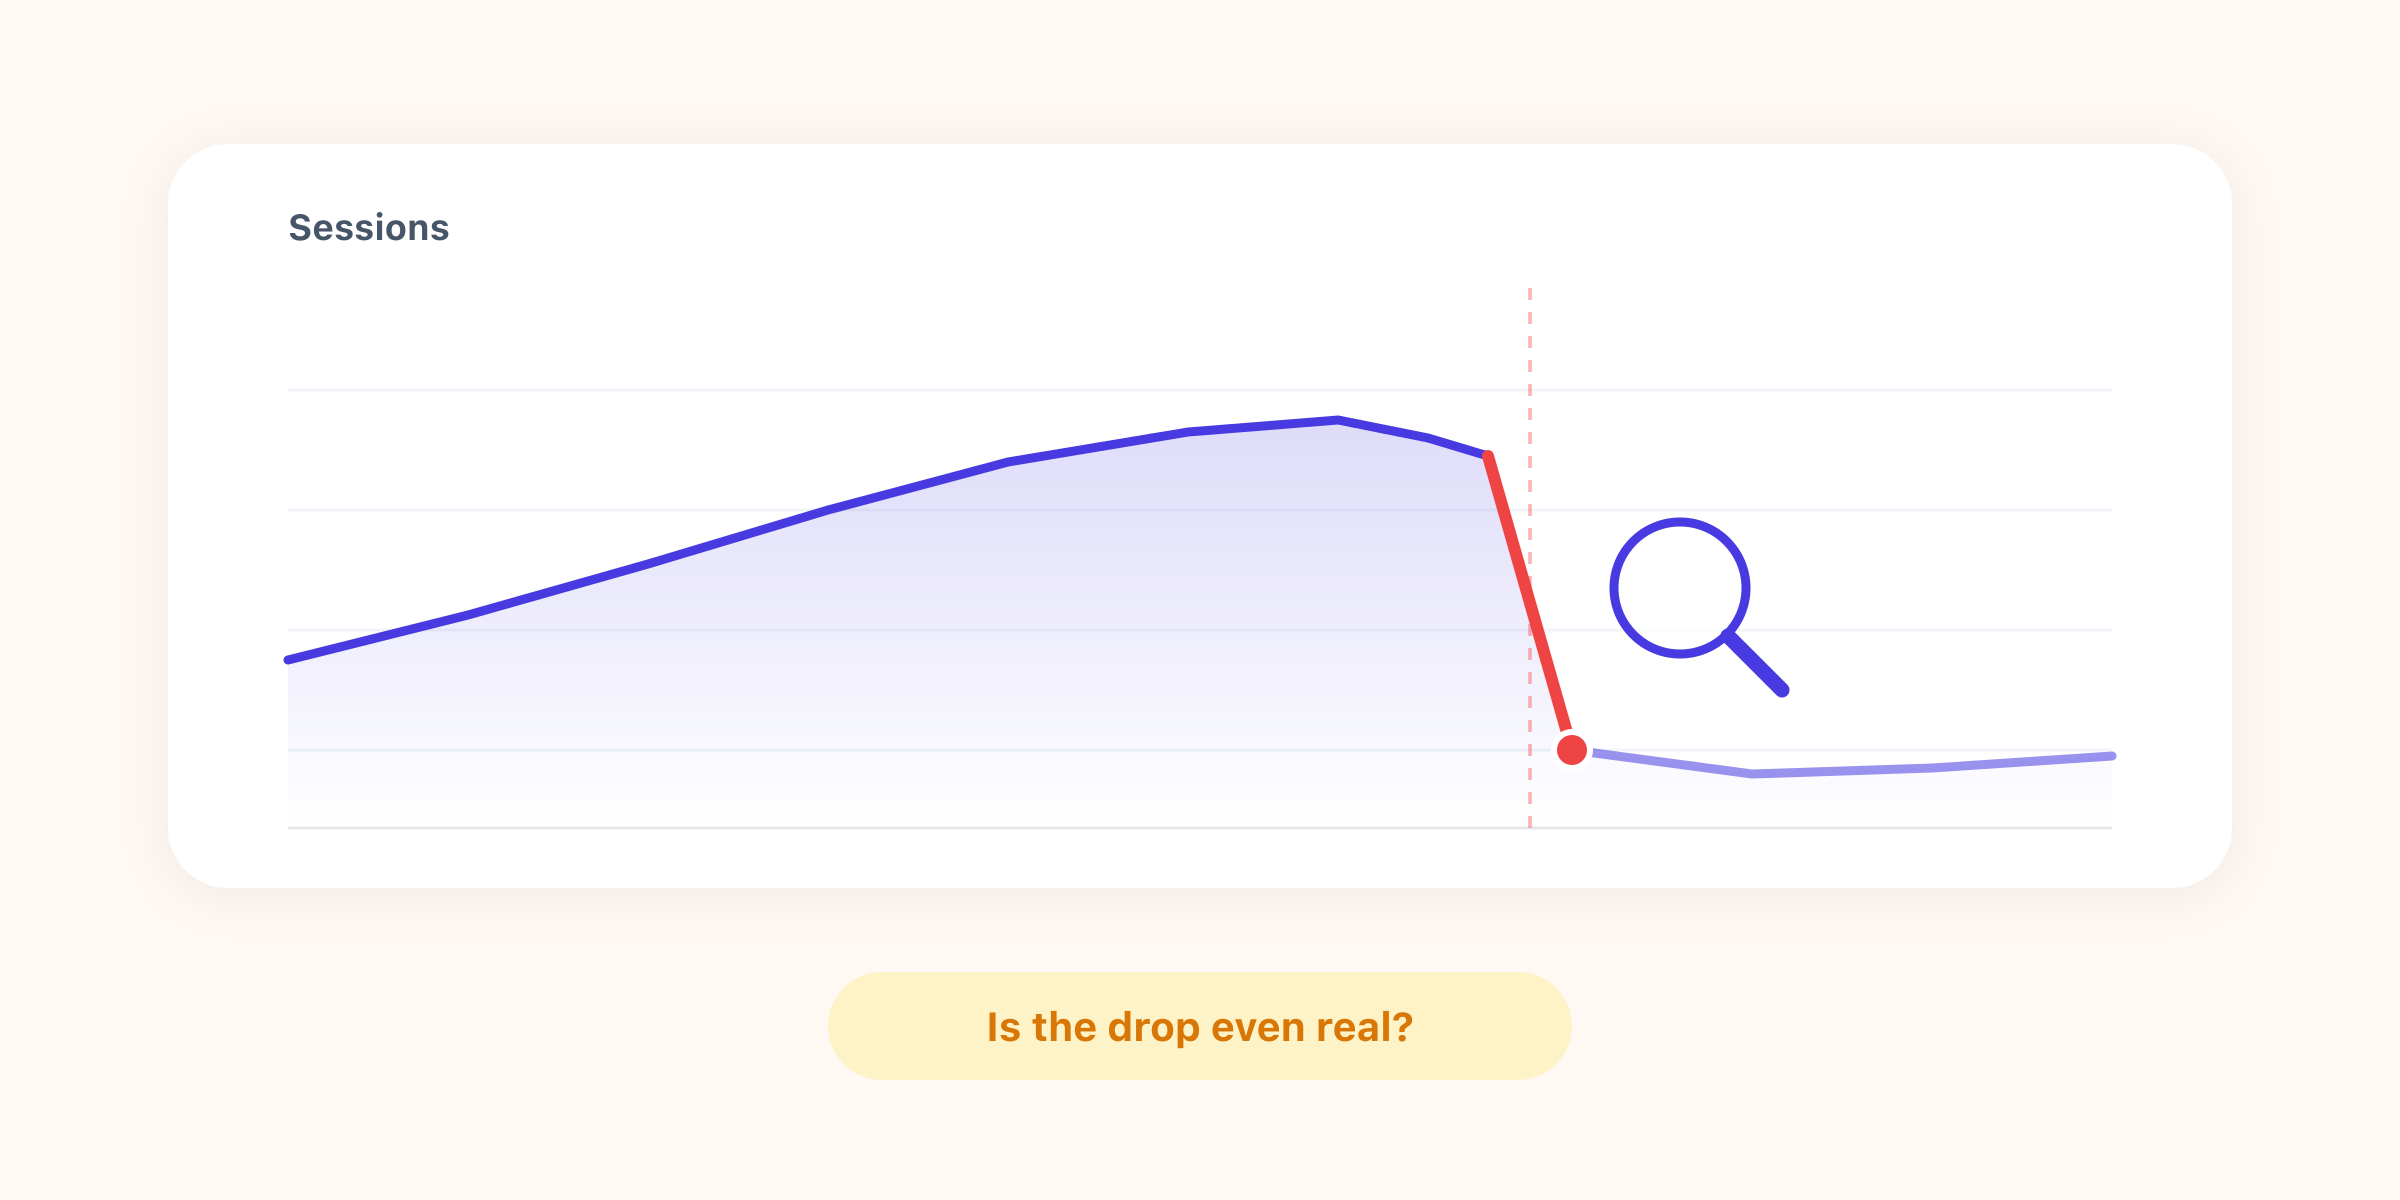
Step 1: Is the drop even real?
Before you chase a cause, rule out a measurement glitch. A large share of the "drops" that land on a marketer's desk are tracking problems, not traffic problems. Check these first, because they're the most common and the easiest to confirm:
- Is your tracking still firing? A site migration, a theme update, or a deploy that overwrote your header is the number-one culprit. Open your site, check real-time data, and view the page source to confirm the script is still there.
- Is your date range fair? Comparing a full week to a partial one, a 31-day month to a 28-day one, or a normal week to a holiday will all show a "drop" that isn't one. Compare like for like.
- Did a bot or spam filter change? A new filter, or bot traffic that suddenly stopped, can move the number without any real change in humans.
- Is it sampling? In GA4, once volumes grow, reports get sampled and become estimates. A "drop" on a small segment can simply be sampling noise.
Step 2: Localize the drop before you diagnose it
A site-wide number hides where the bleeding is. The single most useful move is to segment the drop until you can name it. Slice it four ways:
- By channel (organic, direct, paid, referral, social)
- By landing page or section
- By device (mobile vs desktop)
- By country
The shape of the drop usually points straight at the cause:
| What you see | Most likely cause |
|---|---|
| Cliff to near-zero on an exact date | Tracking broken / tag removed during a change |
| One channel only | That channel's problem (see Step 3) |
| One landing page or section | SEO / page issue: lost rankings, accidental noindex |
| One device only | Technical: mobile layout, speed, a broken CTA |
| Everything, gradually | Algorithm update, seasonality, or market shift |
| Data drops after a banner change | Consent, not visitors (fewer people accept) |
These patterns are easier to recognize once you've seen them drawn out. Four shapes cover most real-world drops, and the cause is often written into the curve itself, before you've opened a single report:

Step 3: The usual suspects, by channel
Once you know which channel dropped, the list of likely causes gets short.
- Organic search down. Check Google Search Console first: did impressions fall (visibility lost) or did clicks fall while impressions held (a CTR or SERP-feature issue)? Look for an accidental
noindexor arobots.txtblock shipped in a recent deploy, deindexed pages, a manual action, or a known algorithm update landing on the same date. And don't forget seasonality. - Direct down (or oddly spiking). Direct is a junk drawer. A "drop" in another channel is sometimes just misattribution. And a large share of AI traffic from ChatGPT, Perplexity and Gemini hides in Direct, so movements there are often unattributed referrals, not real swings.
- Paid down. The boring causes are usually right: a budget ran out, a campaign got paused, ads were disapproved, or a bid change cut your impression share. Check the ad platform before the analytics tool.
- Referral or social down. A big referring site removed a link, a viral post aged out, or a partner changed something. Find which specific referrer disappeared.
Step 4: Technical causes that hit the whole site
If the drop is everywhere at once, suspect the site itself:
- A migration or redesign. Broken redirects, lost URLs, and redirect chains shed traffic fast. And tracking is often not ported correctly to the new site.
- The tracking script removed or duplicated. Duplicated tags can also inflate then "correct" your numbers.
- A consent banner change. A stricter banner, or a newly added "reject all" button, means fewer people accept tracking. Your measured traffic drops even though the real visitors are unchanged. This is a data problem, not a traffic problem, and it's why cookieless analytics that needs no consent banner gives you a more complete picture.
- Site speed, errors, or downtime. A Core Web Vitals regression, a spike in 5xx errors, or an outage during the period will all show up as lost sessions.
Step 5: External causes (rule these in last)
Only once you've cleared the internal causes should you blame the outside world, because it's the one thing you can't fix by reverting a deploy:
- A Google core or algorithm update is the big one for organic. Cross-reference the drop date with known update rollouts.
- Seasonality. B2B dips in summer and around holidays; retail dips after peak. Compare year-over-year, not just week-over-week.
- Market or competitive shifts, or simply the end of a news cycle that was sending you traffic.
The 5-minute triage checklist
When the chart drops, run this in order before you tell anyone the sky is falling:

How Sublim makes the diagnosis faster
Half of traffic-drop firefighting is fighting your own analytics tool. Sublim removes that friction:
- It never samples. A drop is a real drop, not a rounded estimate, so you don't waste time chasing phantom dips, and you don't miss small-but-real ones.
- It captures the full referrer and classifies acquisition automatically, so fewer movements get dumped into an unexplained "Direct" bucket, and the AI traffic that GA4 hides surfaces as its own source.
- It alerts you on anomalies, so you hear about a drop the day it happens, not at the month-end review when the cause is cold.
- It segments Direct by landing page, the exact view you need to tell a real drop from a misattribution.