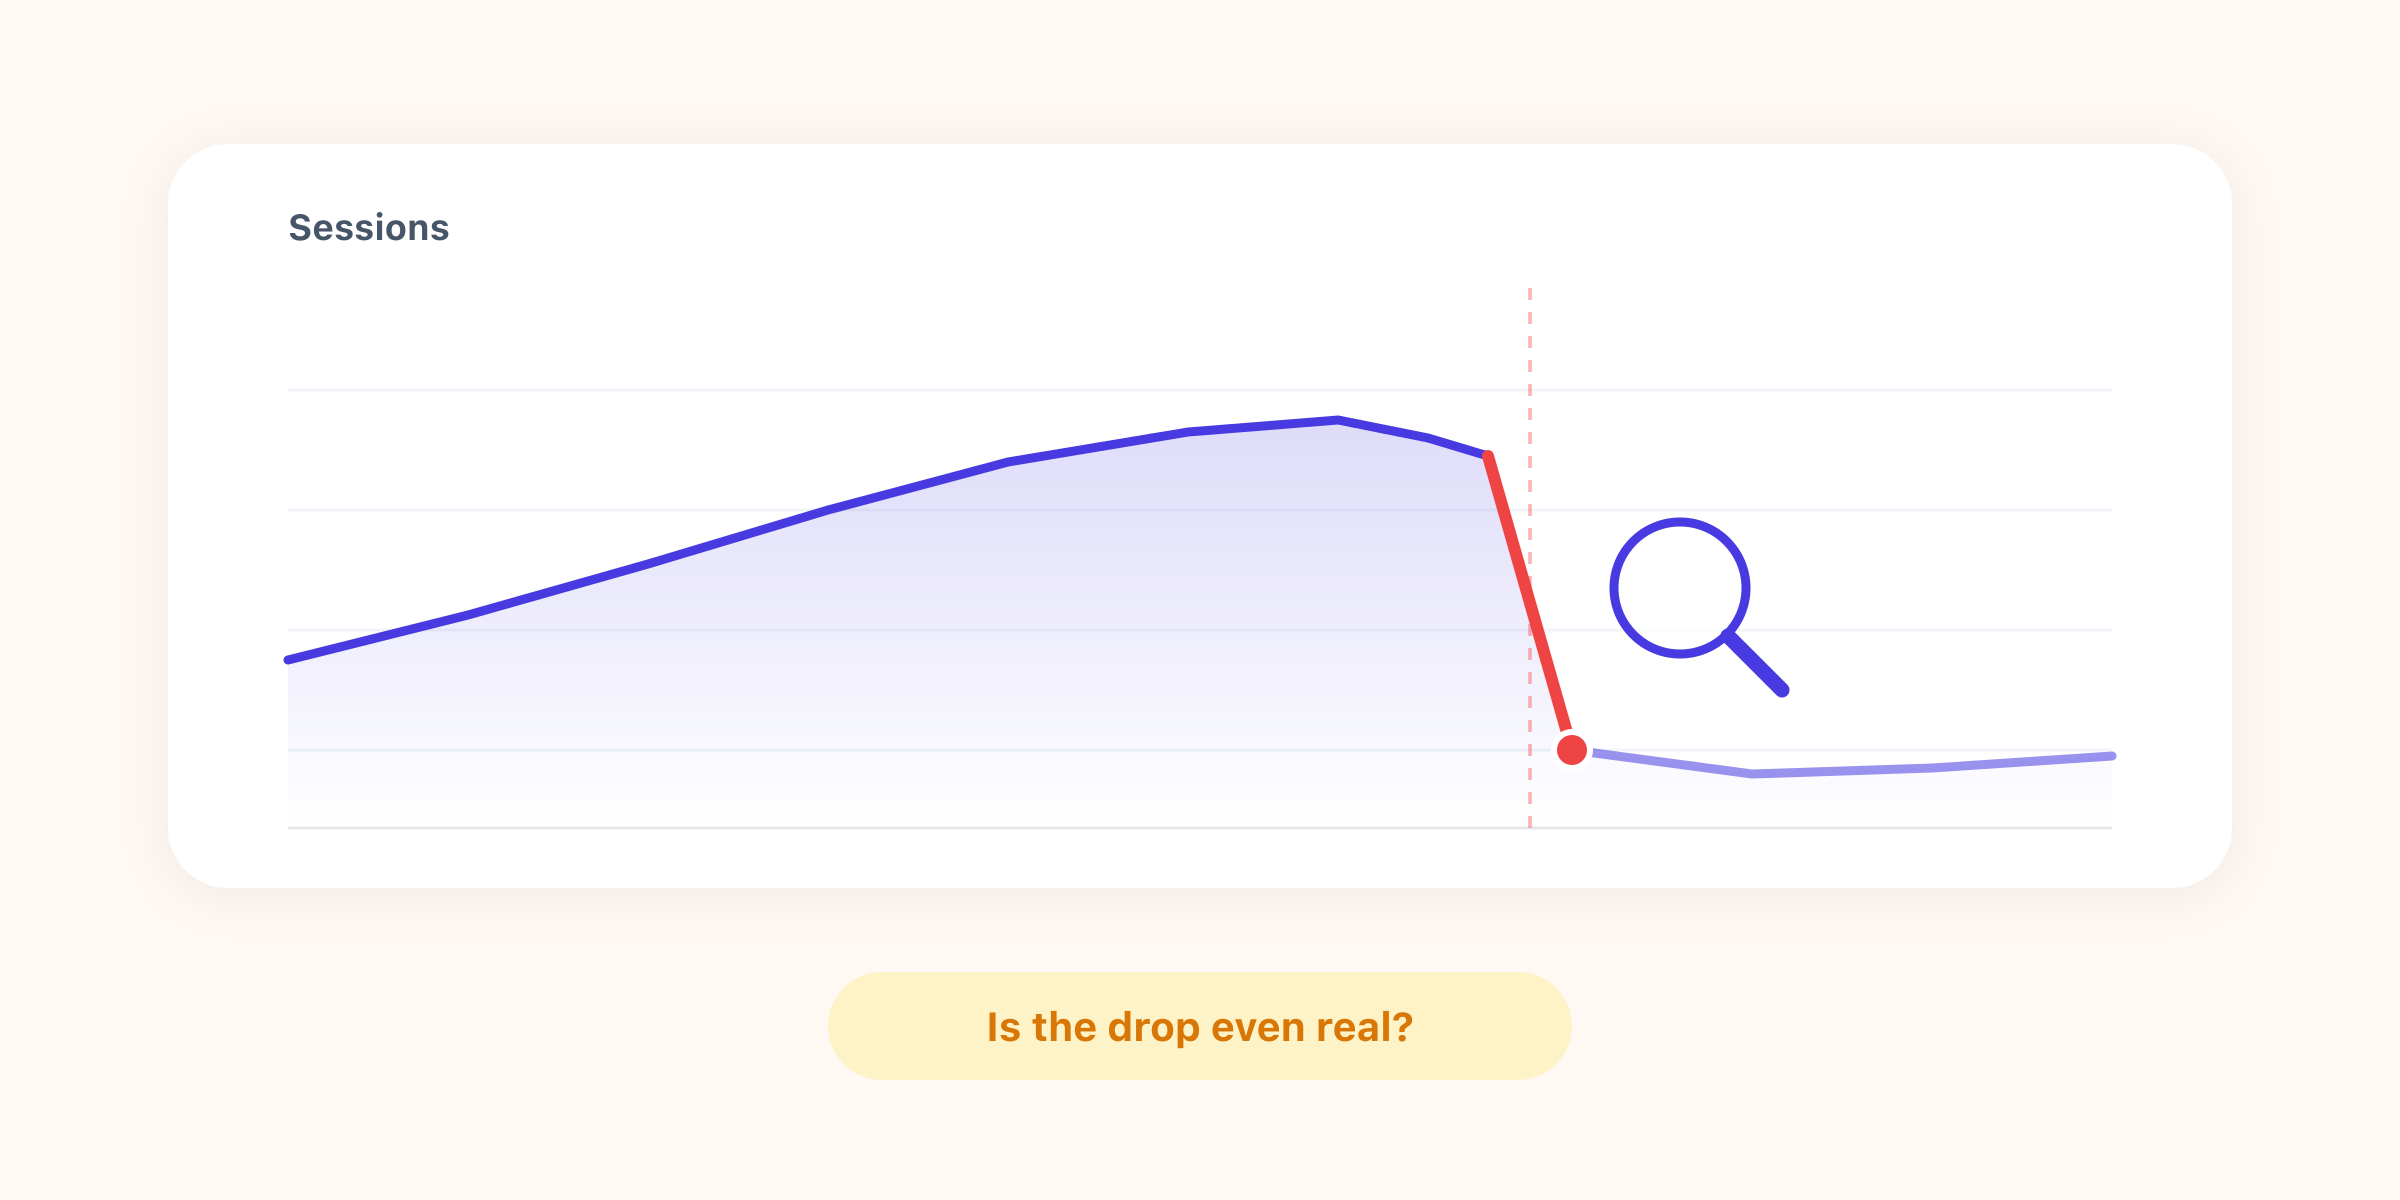
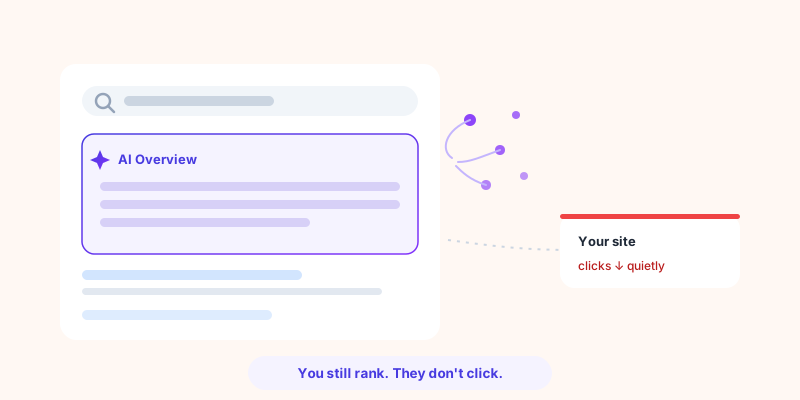
Google now answers a large share of searches before anyone reaches your site. The AI Overview sits at the top of the results, summarizes the answer in a few sentences, and the searcher moves on. You still rank. You still appear. But the click never happens.
This is the quiet kind of traffic drop: nothing looks broken, your rankings are intact, yet sessions keep sliding. The loss is real and measurable, but most teams feel it long before they can see it. This guide explains what AI Overviews actually changed, how to spot their fingerprint in your own data, how to tell them apart from the other things that cut clicks, and what to do once you can measure the damage. Because you cannot recover traffic you cannot see.
What AI Overviews actually changed
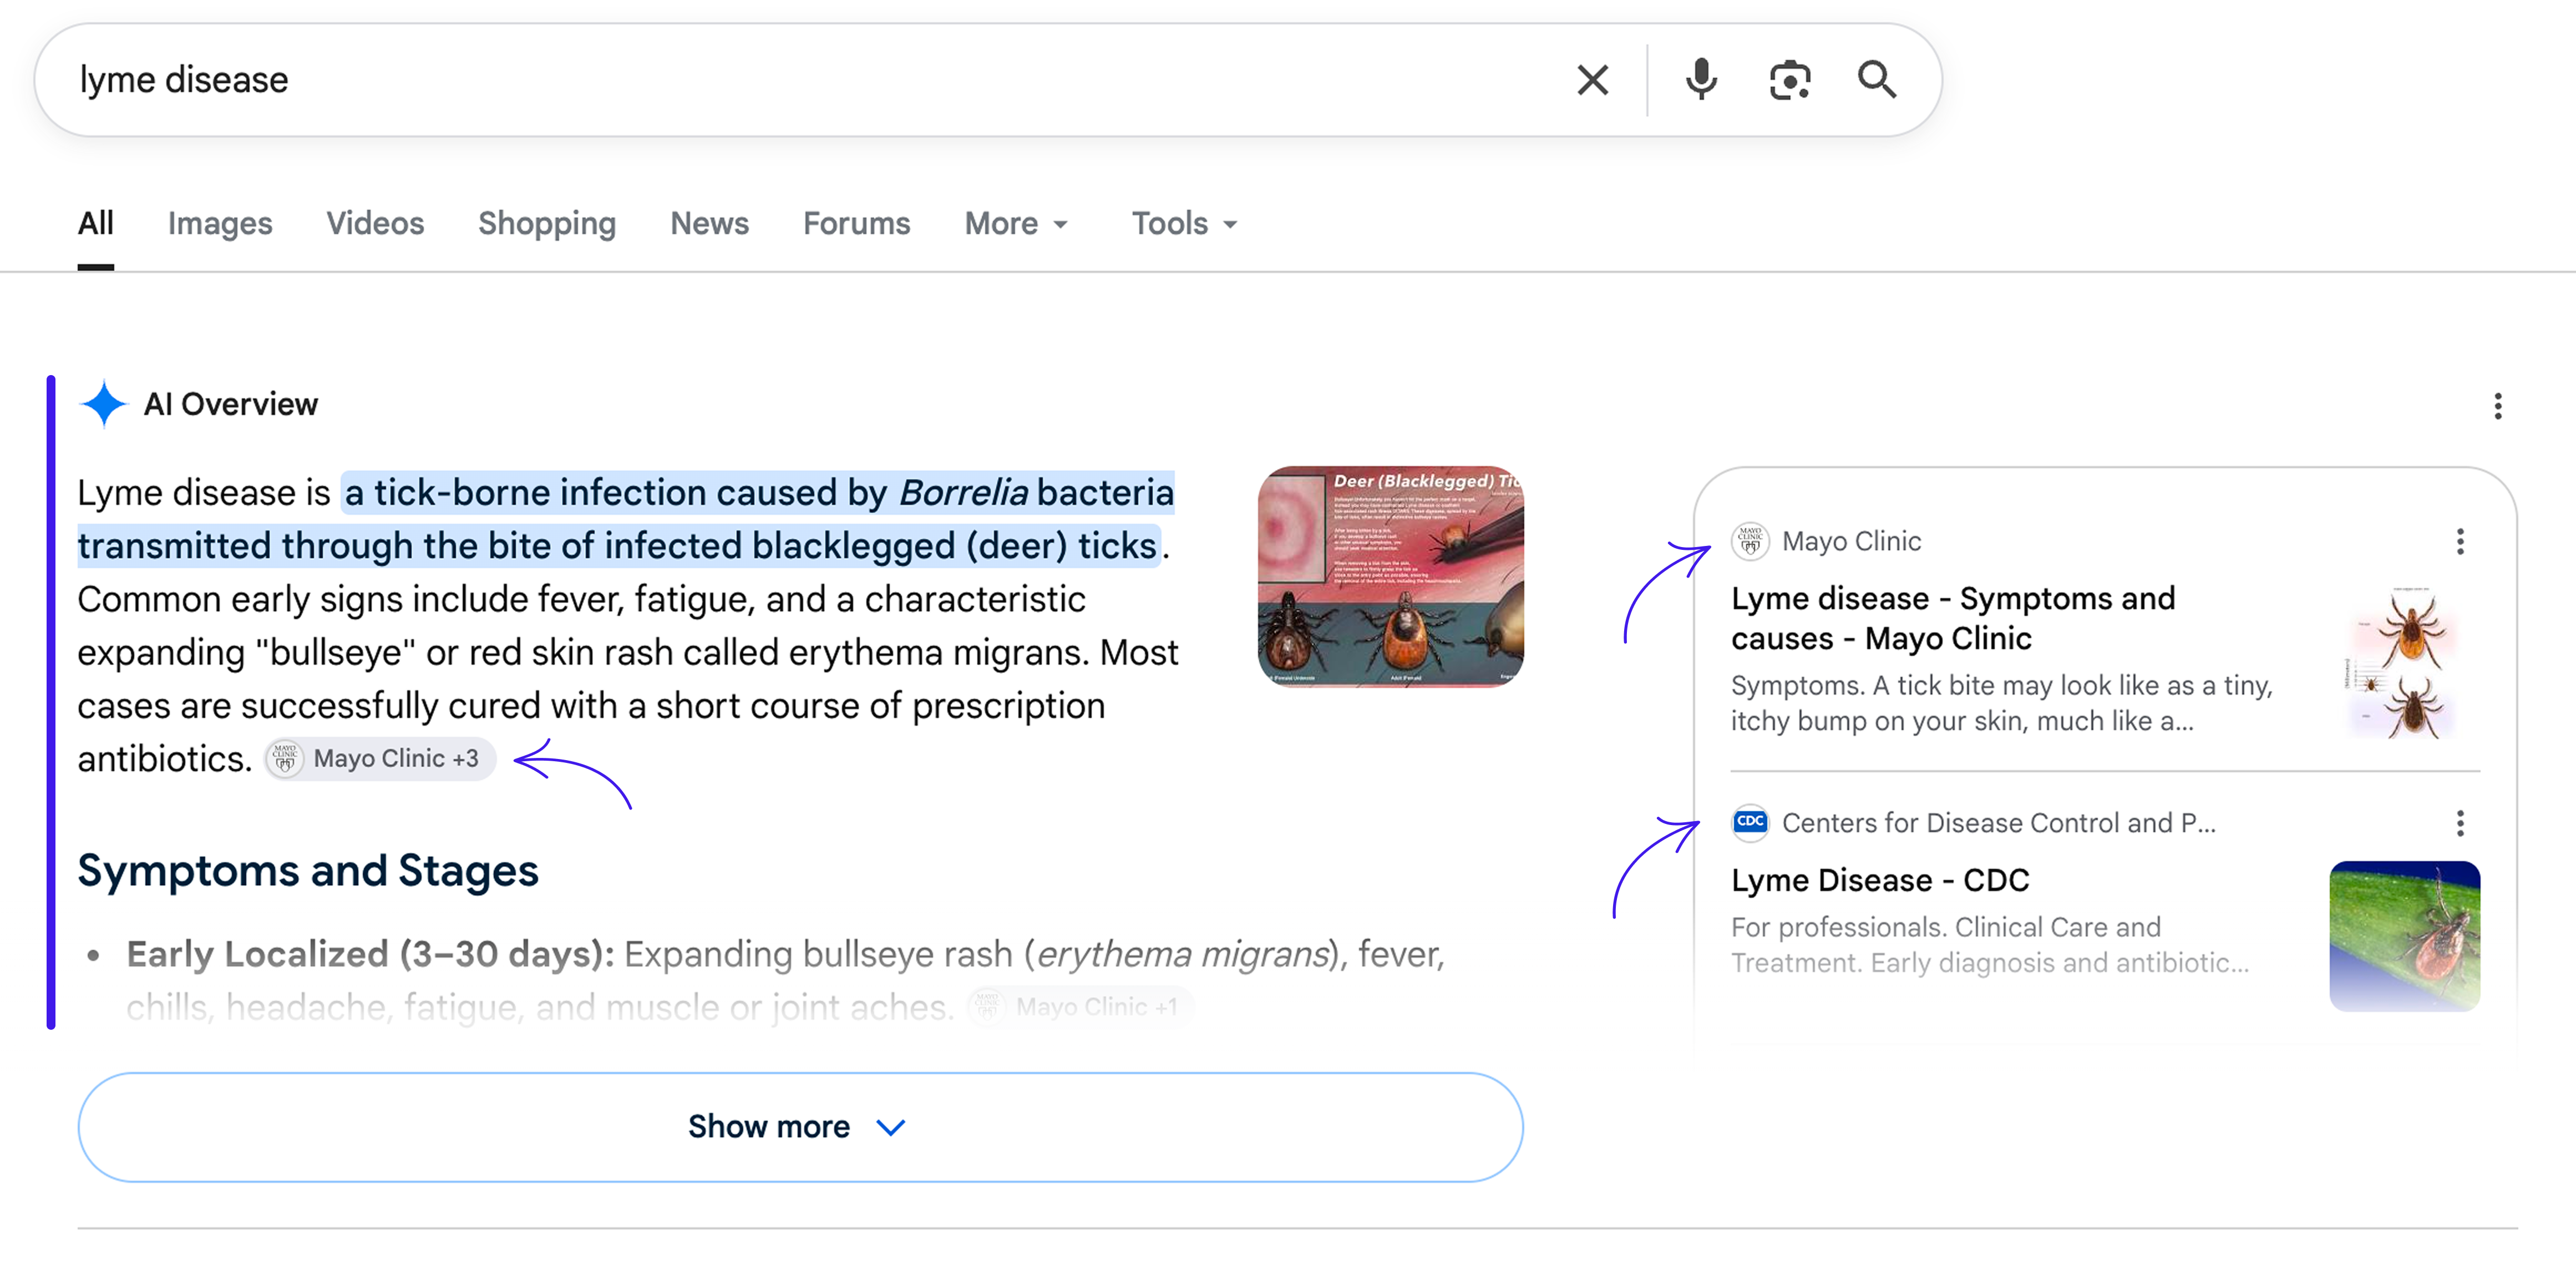
An AI Overview is the AI-generated summary Google places above the classic blue links. For an informational query it often answers the question outright, so the searcher has no reason to click through to anyone.
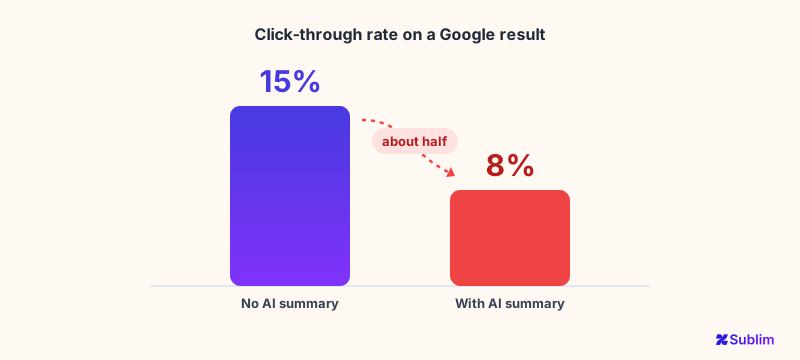
The effect is not subtle. A Pew Research Center study of 68,879 real Google searches found that when an AI summary appeared, users clicked a traditional search result in just 8% of visits, against 15% when there was no summary, roughly half as often. They were also more likely to end their session entirely (26% vs 16%), and 58% of users ran at least one search that produced an AI Overview in a single month.
The strategic shift underneath the numbers: ranking is no longer the same as traffic. You can hold position one and still lose the click to a summary sitting above you.
The fingerprint: impressions hold, clicks fall
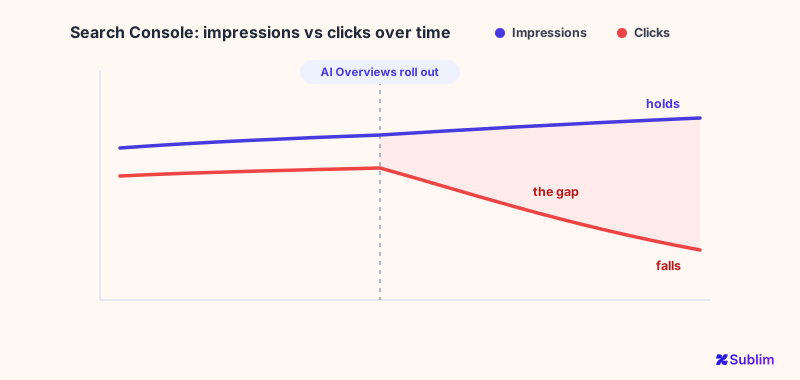
Here is what makes AI Overview loss diagnosable rather than a vague feeling. It leaves a specific signature in Google Search Console:
- Impressions stay flat or even rise. You still appear for the query, often inside or just below the Overview.
- Clicks and click-through rate fall. Fewer of those impressions turn into visits.
That divergence, impressions steady while clicks drop, is the tell. A ranking loss looks different: impressions fall too. A tracking problem looks different: the drop is sudden and total. AI Overview erosion is a widening gap between how often you are seen and how often you are clicked.
It concentrates on informational and question-style queries ("how to", "what is", "best way to"), which is exactly where AI Overviews trigger most. Transactional and branded queries are usually far less affected.
It is not the only thing that can cut your clicks
Before you blame AI Overviews for everything, rule out the look-alikes. Each cause leaves its own signature, and the fix for one is nothing like the fix for another:
| Cause | What you see |
|---|---|
| AI Overviews | Impressions steady, clicks and CTR down, worst on informational queries |
| Ranking loss | Impressions and average position drop together |
| Seasonality | Clicks down but so is demand; impressions fall too, and it recovers on a cycle |
| Algorithm update | Sharp change dated to a known update, spread across many queries at once |
| Tracking or tagging bug | Sudden, total, or impossible drop; Search Console and your analytics disagree |
Getting this right matters. The fix for AI Overview erosion is content and channel strategy; the fix for a tracking bug is a line of code. Misdiagnose it and you can waste weeks solving the wrong problem. Our traffic drop diagnostic checklist walks through the full set of causes.
How to measure it, step by step
- Start in Search Console. Compare clicks against impressions over the last 6 to 12 months. A flat or rising impressions line with a falling clicks line is your first flag.
- Segment by query type. Filter for informational queries (how, what, why, best) and compare their CTR trend against your branded and transactional queries. If informational CTR is sinking while branded holds, that is the AI Overview pattern.
- Go page by page. Sort for the biggest click loss with stable impressions. Those are the pages bleeding to Overviews.
- Anchor to the timeline. AI Overviews expanded through 2024 and 2025; line up your drop with when they rolled out for your market and query set.
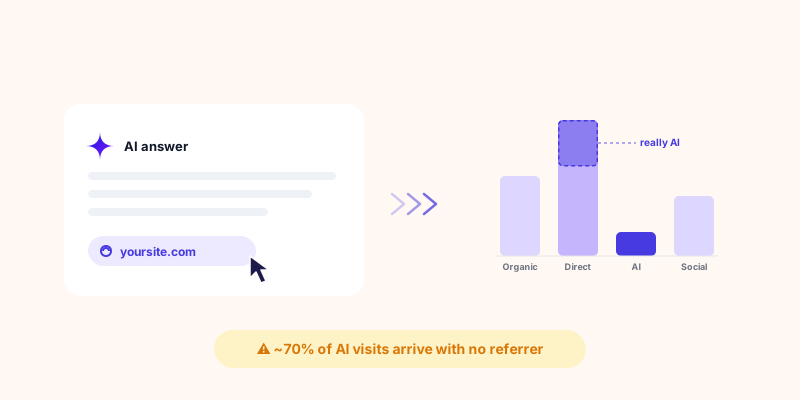
- Watch for the new channel. Some of that lost search traffic returns as AI referral visits from ChatGPT, Perplexity, or Gemini. Measure it separately, because it hides in Direct by default.
What you can actually do about it
This is where honesty matters: no analytics tool restores a click that Google answered for you. The levers here are strategic, not technical.
- Target queries Overviews do not trigger. Deeper, more specific, and transactional-intent queries still send clicks.
- Optimize to be the cited source. When an Overview appears, being one of the links it references still earns some visits and brand exposure. The levers are the ones that have always earned citations: genuinely useful content, a clear structure a model can extract, and references from other credible sites.
- Build demand you own. Brand, direct, email, and community traffic do not depend on a Google click.
- Diversify channels. If organic search is your single point of failure, AI Overviews are an existential risk. If it is one of five channels, they are a manageable dip.
Every one of these is a bet, and the only way to know whether a bet paid off is to measure the channels before and after. Which brings us back to the point: fix what you can, but measure everything.
How Sublim helps
Sublim is the diagnostic layer, not the cure. It will not win back a click Google kept, and it does not pretend to. What it does is make the data visible and your response measurable. It brings your Search Console impressions, clicks, and CTR together, page by page, so the signature is easy to read for yourself, impressions holding while clicks fall, and easy to tell apart from a ranking drop, a seasonal dip, or a tracking bug. And when a visit from an AI assistant carries a referral signal, it classifies it as its own acquisition source instead of leaving it in Direct, so you can see the AI referrals it can attribute and whether those visitors convert. Some assistants strip the referrer, so that is a floor, not the full picture. You cannot recover what you cannot measure. Sublim is how you measure it.