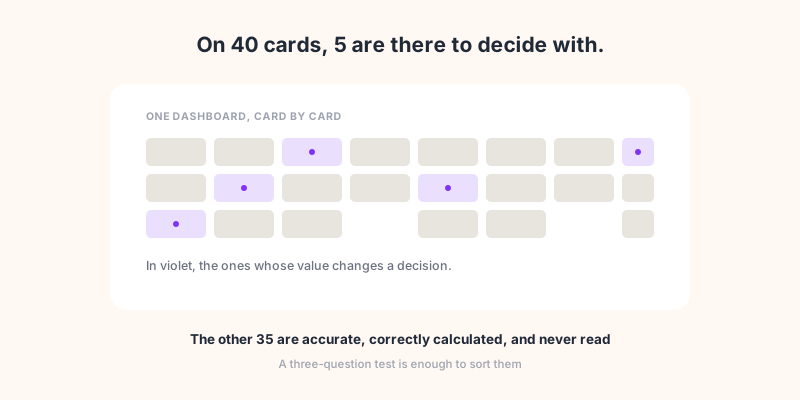
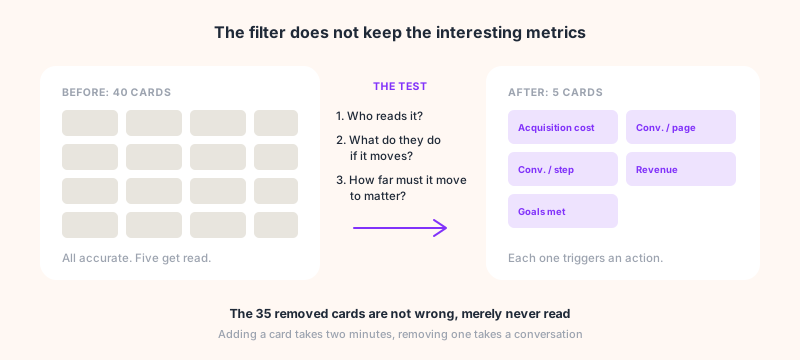
Open a dashboard at random, yours or a client's. Count the cards. Then ask, for each one, what somebody would do differently if the number doubled this month. On a forty-card dashboard, the honest answer usually lands around five.
The other thirty-five are not wrong. They are accurate, correctly calculated, and nobody looks at them. They were added one at a time, each for a good reason, and never removed. This article does not offer the list of metrics to track: it offers a test for deciding what stays and what goes, and names the numbers that look most like information without being it.
The three-question test
A metric earns its place when all three answers exist:
Who reads it? Not "the team". One person, with a name and a job. If nobody steps forward, the metric is there to reassure whoever built the dashboard.
What does that person do if the number moves? A concrete action: restart a campaign, rewrite a page, call a supplier, stop a spend. "Monitor it" is not an action, it is an intention.
How far does it have to move to matter? A threshold. Without one, every variation is debatable and none decides anything. This is the question that removes the most cards, because it forces you to admit you do not know when to start worrying.
A metric that passes all three is an instrument. One that fails the third is a curiosity: interesting, not decisive. One that fails the second is decoration.
Why a dashboard always grows
The accumulation is not a failure of rigour, it is an asymmetry of cost. Adding a card takes two minutes and pleases whoever asked for it. Removing it means explaining to that same person why their number did not deserve to be there. The first move upsets nobody, the second is a conversation.
On top of that sits a meeting habit: showing a lot looks more serious than showing a little. A dense dashboard looks like thorough work, a six-number dashboard looks lazy, when the second one required the decisions the first one avoided.
The cost does not show up in the dashboard, it shows up in the time spent producing it. On agency client reporting, only a quarter of the hours go to analysis: half goes to pulling and assembling. Every card added weighs on that half, not on the one that carries value.
A metric is not an analysis
The confusion is common and it has practical consequences. A metric is a number: 12,400 sessions. An analysis is a sentence saying what that number means and what to do about it: sessions are up 18% but only on an obsolete page, so sign-ups will not follow.
A dashboard delivers metrics. It never delivers analysis, not even when it shows green and red arrows, because an arrow compares two numbers without knowing why they differ. That is why a rich dashboard does not replace somebody reading it: it moves the interpretation work onto whoever receives it, usually the person with the least time for it.
The practical consequence for whoever builds it: a dashboard should carry few numbers and one sentence. Not forty numbers and no sentence.
Three readers, three dashboards
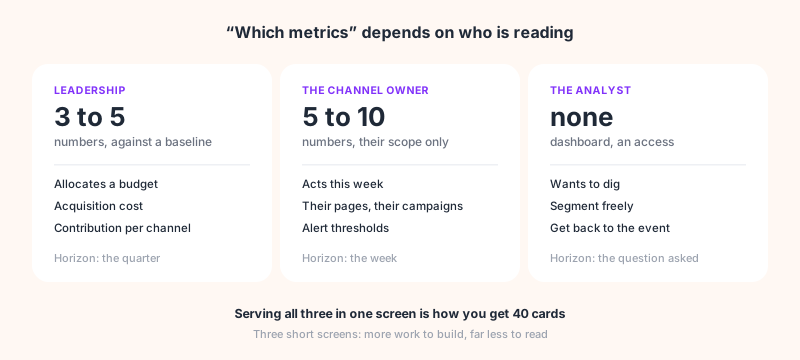
"Which metrics should we track" has no single answer because it depends on who is reading. Three readers, three incompatible needs, and trying to serve them in one screen is how you end up with forty cards.
Leadership wants one number and a direction. A marketing director does not run a channel, they allocate a budget. What matters to them is acquisition cost against customer value, and each channel's contribution to the whole. Three to five numbers, compared to a baseline, with the sentence that goes with them. Beyond that, they will read the first two and ignore the rest.
The channel owner wants to act this week. They need the detail of their own scope and nothing else: their campaigns, their pages, their conversions, with thresholds that trigger an action. Five to ten numbers, refreshed often.
The analyst wants to dig. Not a dashboard, access. What serves them is the ability to segment and get back to the event, not one more card on a shared screen.
For an agency this is the point that costs the most to ignore: the dashboard is built by somebody who knows the numbers, for somebody who does not. What is obvious to the first is never obvious to the second.
Numbers that look like information
Some metrics fail the test while keeping the appearance of usefulness. They are worth naming, because they occupy the best positions on most dashboards.
A total with nothing to compare it to. 12,400 sessions means nothing alone. Against the same month last year, the same weekday, or the target, the number becomes readable. A card showing a bare total asks the reader to remember last month.
A rate without its volume. An 8% conversion rate on 25 visitors is not a conversion rate, it is noise. Showing the percentage without the count is the most common way to make a dashboard say anything you like.
Average time on page, when it is raw dwell time. The classic version measures the gap between two pageview timestamps. So it counts the forty minutes of the tab left open over lunch, and counts zero for the last page of a visit, for want of a following timestamp. Measured as engagement time the number becomes readable again: the counter pauses the moment the tab loses focus, and accumulated time is dropped if the tab stays hidden. Before putting this metric on a screen, check which of the two your tool computes: the same label covers both.
Bounce rate taken for a quality signal. A high bounce on a page that answers the question above the fold is a success, not a failure. The number says nothing outside the context of the page, which the diagnostic guide works through.
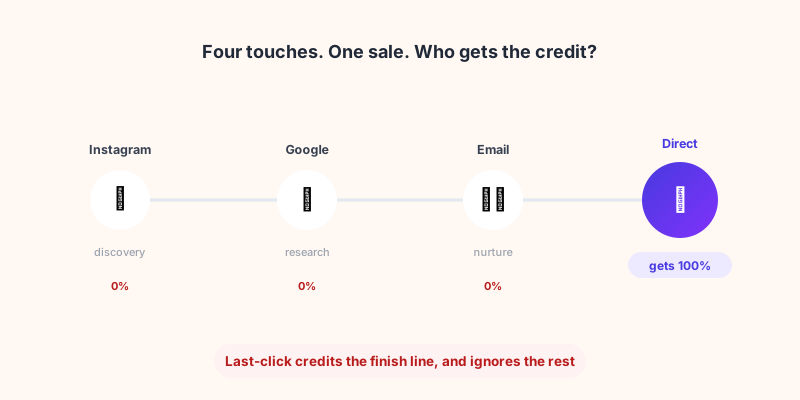
The last source before the conversion, presented as the cause. Last click is a counting convention, not an account of the journey. Treating it as the cause leads to cutting the channels that open the journey, the subject of our attribution article.
What each metric triggers, and when it misleads
The test gets concrete applied row by row. A metric with no action on its right has no business being on the screen.
| Metric | What it triggers | When it misleads |
|---|---|---|
| Acquisition cost per channel | Reallocate budget between channels | When customer value differs by channel |
| Conversion rate per landing page | Rewrite or retire a page | Under a few hundred visits, noise dominates |
| Conversions per funnel step | Fix the step losing the most | When a step is optional yet counted |
| Sessions per source | Nothing alone, useful as a denominator | When a share lands in direct for want of tagging |
| Scroll depth | Move a block or a button | On short pages everyone reaches the bottom |
| Average time on page | Compare attention from one page to the next | As raw dwell time: the forgotten tab counts, the last page counts zero |
| Pageview count | Nothing, unless you sell advertising | Goes up when navigation is bad |
Three rows trigger a clear action, three only help alongside another or under a condition, one triggers nothing. This is not a universal rule: on a media site, pageviews are the revenue, so they go to the top of the table. The test is redone for each business, which is what makes it useful.
By funnel stage
A simple way to check a dashboard leaves no gap: four stages, and at least one metric that passes the test at each.
Awareness. Reach, impressions, frequency. Few direct actions, but it is the denominator for everything else.
Engagement. Scroll, interactions, returning visitors. This is where comfort metrics breed most, so where the test removes most.
Traffic. Sessions, sources, landing pages. Useful broken down, rarely as a total.
Conversions. Goals met, cost per acquisition, revenue. The stage where almost everything passes the test, and the one most often pushed to the bottom of the screen.
A dashboard with nothing at the last stage measures activity, not results. It is the most frequent defect, and the one that costs the most the day somebody asks what all of it returned.
How Sublim helps
The product ships more than forty ready-to-use KPIs, sorted by category and live from install with no setup. Reports are built from around thirty templates rather than from a blank page, which heads off the dashboard that grows with every request.
When no catalogue indicator fits your business, a custom KPI is composed from the existing ones, with its own format and display shape. That is what lets you keep the screen short: you build the number you need instead of stacking three approximate cards.
On the most important point of this article, the sentence missing next to the numbers, Sublim reports arrive with a generated analysis: a summary separating wins from points of attention, and ranked recommendations. Treat it as a first pass, not a verdict: it does not know the dip is an annual shutdown unless somebody wrote that down.
The numbers themselves are complete rather than estimated, which changes the nature of the meeting: a dashboard whose totals are sampled gets debated instead of decided, a subject of its own.